Sorry, this site is not yet mobile/tablet friendly.
Canny Edge Detection
Canny Edge Detection is an image processing algorithm for detecting edges in an image. By computing the horizontal and vertical "gradients" around each pixel (i.e. a measure of how color is changing around a given pixel), one can deduce which pixels are most likely to represent edges of objects.
Sliders are included to allow the user to manipulate the thresholds involved in determining edges. If you want to learn more about how Canny Edge Detection works, follow this link:
AI Shack - Canny Edge DetectionCopresence Networks - A Data Visualization
When monitoring the behaviour of a group of individuals for suspicious activity, it can be useful to keep track of pairs of individuals who often perform the same actions simultaneously. For the purposes of this project, let's assume we have a list of flights, each containing the ids of the passengers who were on that given flight. We want to find out how many flights each pair of passengers took together.
This project aimed to visualize the results of this endeavour. To accomplish this, a circle is drawn for each passenger, and each pair of passengers is connected with a line whose color corresponds to the number of flights the passengers shared. Only those pairs of passengers who had co-occurences over a given threshold are shown, and the threshold can be changed with a slider.
The reason I find this problem so interesting is in the elegance of its solution. In the currrent context, it appears that to count the number of copresences between each pair of passengers, there is no better algorithm than an exhaustive search through each pair. The key to unlocking the solution to this problem is in translating the data into a different form.
Assign each passenger a bit vector. For a given passenger, each bit in its vector indicates whether or not the passenger was on that given flight. Stack all these bit vectors next to each other and you get a matrix with height and width corresponding to the number of flights and passengers respectively. Multiply this matrix by the transpose of itself. The resulting matrix with then corresponds to a weighted graph with edges weighted according to the number of co-occurences between each pair of passengers. Now there are algorithms out there that speed up matrix multiplication, like Strassen's algorithm for example. This shows that you can do better than brute forcing it after all!
The Mandelbrot Set - A Fractal Journey
If I had to choose one concept in computer science with the coolest applications, I would definitely have to go with recursive programming. Not only does recursion unlock low-complexity solutions to what would otherwise be high-complexity, iterative processes, it also is the key to visualizing a type of geometry known as fractal geometry.
Fractal Geometry was the brainchild of Benoit Mandelbrot, a 20th century mathematician. It is used to describe the geometry of shapes that are self similar at different scales. The fractal in this module is named after Mandelbrot, and I especially love the chaotic visuals in this one.
One unforseen side-effect of my implementation of this visulization is that as you zoom in on the image, eventually, the limit of numeric precision for floats is reached and zooming is no longer possible. Down the road, I'd like to see how others have dealt with this issue to get down to the depths of the Mandelbrot set.
Tetris - Another Classic
For this project, I thought I'd try and tackle the classic arcade game, Tetris. This is definitely the biggest project I've taken on up until now, but it turned out to be a really awesome excercise in object oriented programming.
The whole reason I keep these projects going is to keep my coding skills sharp. The concepts you learn when taking on a project like this always seem to come up again at some unexpected time. That realization of analogy between seemingly different problems is what keeps me working on these.
Minesweeper - A Classic
Minesweeper has always been my go to time-killer, so I had to give coding it a go. This one ended up being a really fun challenge with an awesome recursive algorithm to deal with the rippling out that happens when a zero is clicked. Check it out!
Aviation Accidents - A Data Visualization
In searching the web for datasets to play around with, I stumbled upon this historical record of aviation accidents. With thousands of flights taking off each hour from airports around the world, there have only been 142 crashes since 2000 that have killed more than ten people; quite a miniscule fraction.
All data was collected from the US National Transportation Safety Board database on aviation accidents. The visualization was created with p5.js, with some help from the MapBox API.
Fractal Trees - A Fractal Playground
My first introduction to fractals was a tree branching example that went something like this...
Consider a straight line, and a function that appends two branches at a certain angle to the end of that line. Now call that function on the two new branches, and on the four new branches after that, and so on and so forth. The resulting structure is a beautiful, tree-like fractal!
This GUI allows the user to play around with the angle, colour, and sizing of the branches to dynamically create new fractal trees using only sliders.
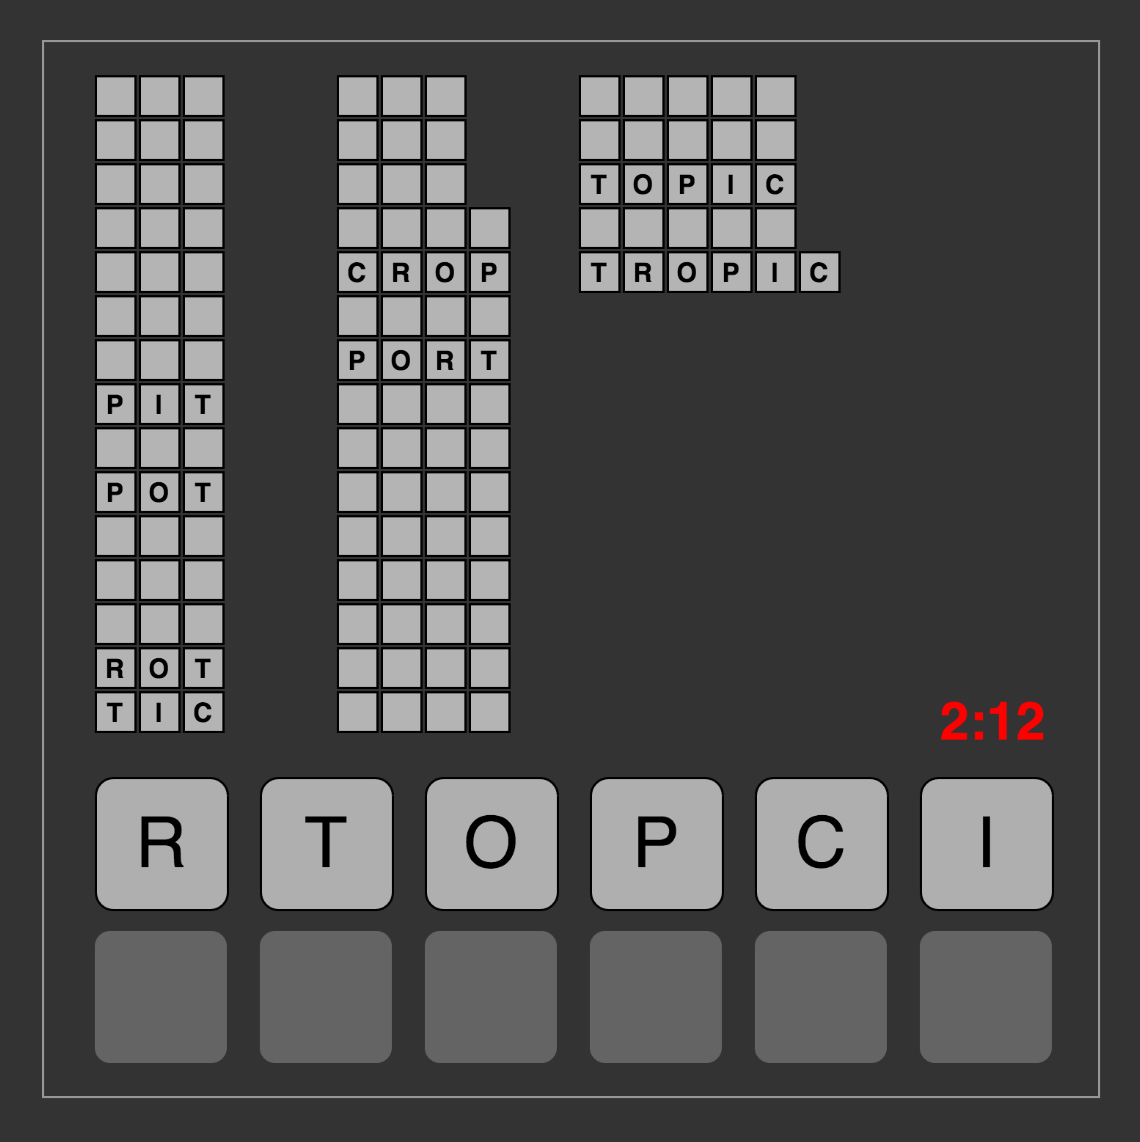
Word Twist - A Word Puzzler
For the other crossword fanatics out there who lack a morning newspaper to get their fix, here's my favorite word puzzler.
For those not familiar, you are given six letters, with the objective being to find all the words of three letters or more that can be constructed from permutations of the original six letters. Though the rules are simple, the game can be quite challenging (especially with an oversized dictionary as a lookup).
L-System Trees - A Fractal Generator
In 1968, Hungarian biologist Aristid Lindenmayer introduced a system that converts strings of characters into geometric shapes. The L-System describes a beautiful isomorphism between the string,
"F[++F-F-F][--F+F+F]"
and the tree structure seen in the image provided. To translate, move forward and draw a line for each 'F', save branch points and return to them with '[' and ']', and rotate with '+' and '-'. Repeatedly replacing each 'F' with a copy of the string itself yields a beautiful fractal structure. Using this GUI, you can play around with different strings and see what fractals they lead to!
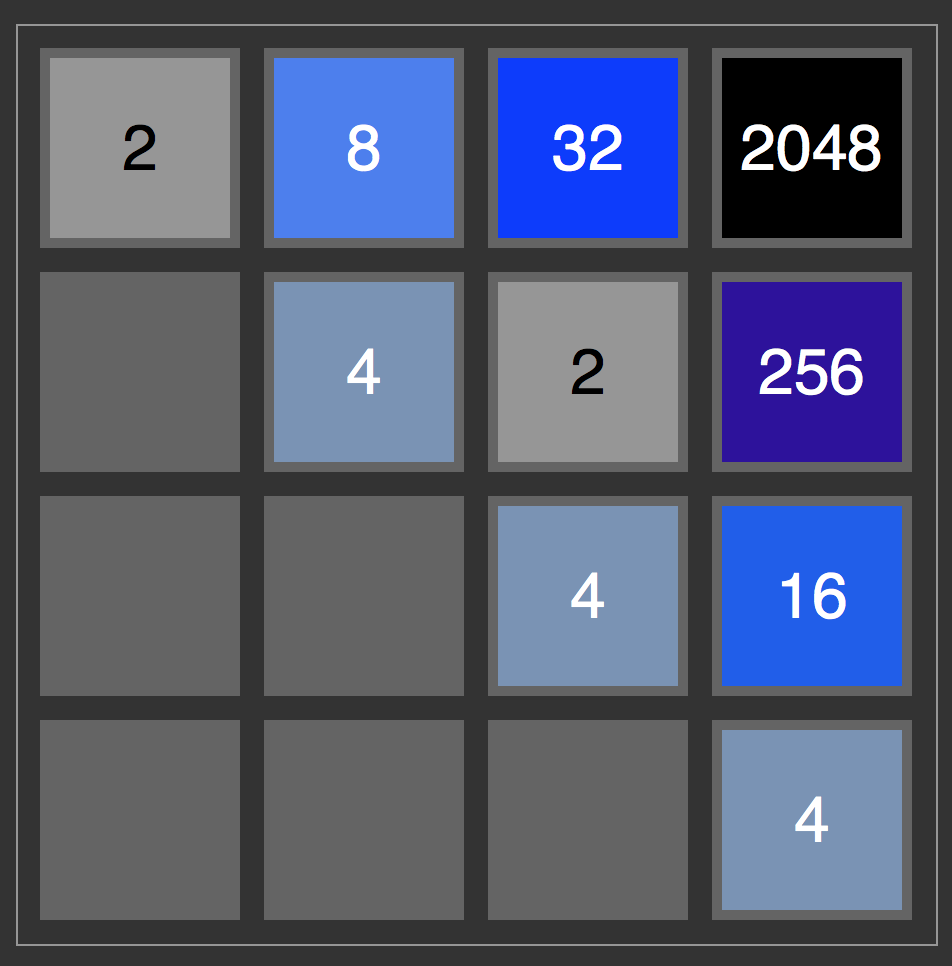
2048 - A Dynamic Puzzle Game
I have always been a sucker for a good puzzle game, and when this game went viral a few years back, I know I wasn't the only one who played it for hours on end.
For those who are not familiar with the game, the numbered tiles can be slid around in all four directions using the arrow keys. When two tiles of the same value collide, they merge and sum together in value. The objective of the game is to sum together enough tiles to create one with value 2048.
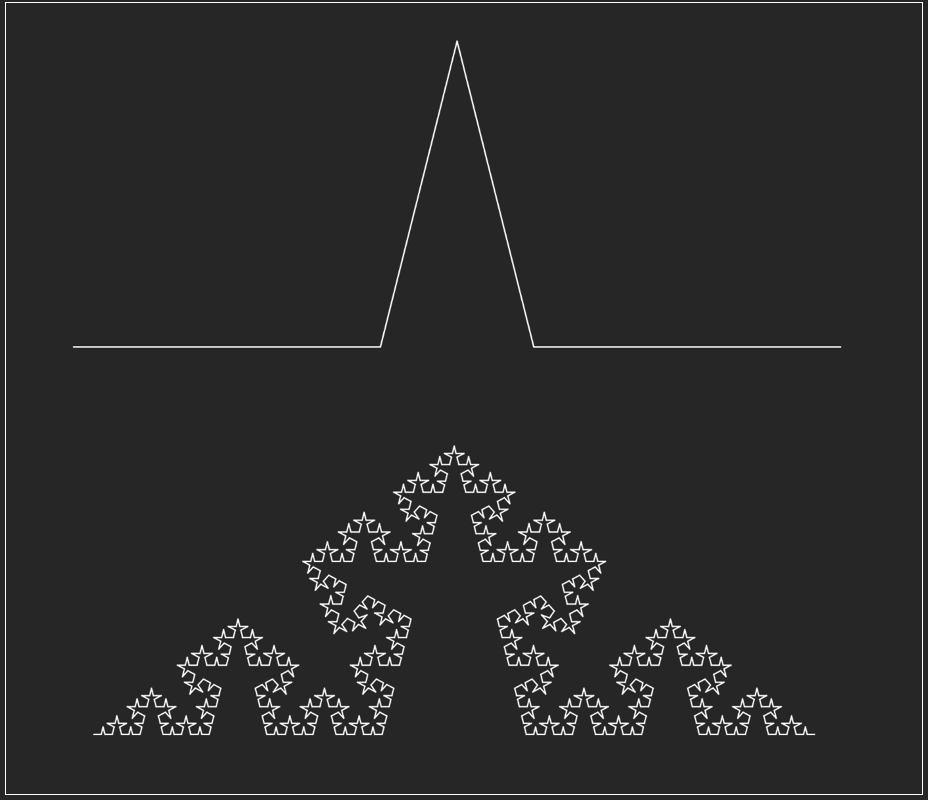
Koch Snowflakes - A Fractal Generator
As a Mathematics and Computer Engineering student, my fascination with fractals is probably not too surprising. The Koch Snowflake is one of my favorite fractals, which takes a seed and replaces each line within it with a copy of itself.
Play around with different seeds and see what cool fractals you can come up with!